Strangle vs Straddle Options: Performance Data, Win Rates, and When to Use Each (2025)
Lambda Finance compared strangle vs straddle options using backtest data from Panoptic Research, projectfinance’s 11-year SPY study, tastytrade mechanical strategy results, and Fidelity’s event-driven options analysis. This report covers both long and short variants across daily, weekly, and monthly rebalancing frequencies. The key finding: short straddles produce higher median returns (+1.80% monthly) but larger drawdowns (-13.7%), while short strangles offer tighter risk profiles with lower median returns (+1.25% monthly) and shallower drawdowns (-11.1%). For long strategies, straddles respond faster to volatility but cost roughly 2x more than strangles, requiring smaller moves to break even. The tables below quantify every dimension of the strangle vs straddle options comparison with backtest data.
1. Strangle vs Straddle Options: Side-by-Side Comparison
The table below provides a structural comparison of strangle vs straddle options across the key variables that determine which strategy to deploy.
| Dimension | Straddle | Strangle | Advantage |
|---|---|---|---|
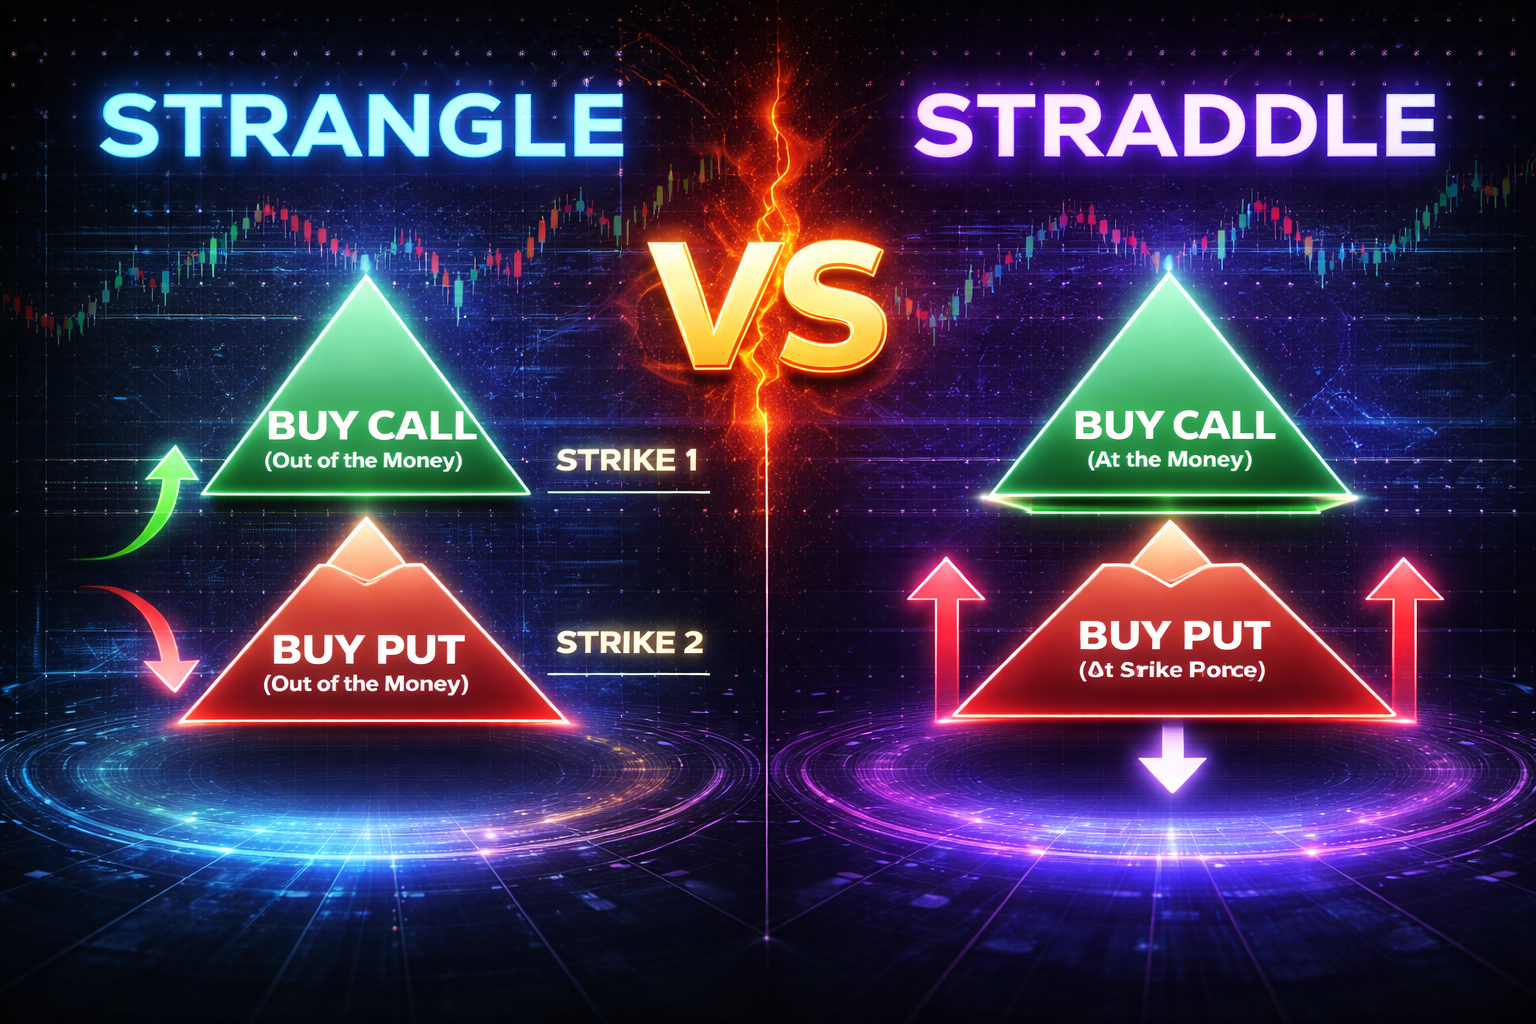
| Strike Selection | ATM call + ATM put (same strike) | OTM call + OTM put (different strikes) | — |
| Premium Cost (Long) | Higher (~2x strangle) | Lower | Strangle |
| Premium Collected (Short) | Higher | Lower | Straddle |
| Breakeven Width | Narrower (easier to profit) | Wider (needs bigger move) | Straddle (long) |
| Win Rate (Short, daily) | 70.96% | 68.22% | Straddle |
| Win Rate (Short, weekly) | 58.49% | 60.38% | Strangle |
| Max Drawdown (Short) | -13.7% | -11.1% | Strangle |
| Margin Requirement | Higher (ATM = more risk) | Lower (OTM = less risk) | Strangle |
| Theta Decay Capture | 40–50% of daily theta | ~25% of daily theta | Straddle |
| Risk Profile | Unlimited (short); Limited (long) | Unlimited (short); Limited (long) | — |
The strangle vs straddle options trade-off is fundamentally about premium versus probability. Short straddles collect more premium and capture more daily theta (40–50% vs ~25%), but carry larger drawdowns and higher margin requirements. Short strangles win slightly more often on weekly timeframes (60.38% vs 58.49%) and suffer smaller worst-case losses. For long strategies, straddles cost roughly 2x more but have narrower breakeven points, meaning the underlying needs to move less to generate profit.
Short Straddle vs Strangle: Win Rate by Rebalancing Frequency
| Daily |
Straddle 70.96%
|
|
Strangle 68.22%
|
|
| Weekly |
Straddle 58.49%
|
|
Strangle 60.38%
|
|
| Monthly |
Straddle 66.67%
|
|
Strangle 66.67%
|
|
Chart: Lambda Finance | Data: Panoptic Research (May 2024 – Apr 2025)
2. Short Straddle vs Short Strangle: Backtest Performance
The table below compares short straddle and short strangle performance across three rebalancing frequencies using Panoptic Research data and projectfinance’s 11-year SPY study.
| Metric | Short Straddle | Short Strangle | Winner |
|---|---|---|---|
| Daily Rolling | |||
| Win Rate | 70.96% | 68.22% | Straddle |
| Sharpe Ratio (Return) | 0.021 | -0.002 | Straddle |
| Weekly Rolling | |||
| Win Rate | 58.49% | 60.38% | Strangle |
| Sharpe Ratio (Return) | 0.018 | -0.028 | Straddle |
| Monthly Rolling | |||
| Win Rate | 66.67% | 66.67% | Tie |
| Median Monthly Return | +1.80% | +1.25% | Straddle |
| Max Monthly Return | +6.62% | +5.21% | Straddle |
| Max Monthly Loss | -13.68% | -11.07% | Strangle |
| Sharpe Ratio (Return) | -0.048 | -0.082 | Straddle |
Short straddles outperformed short strangles on return metrics across all three frequencies: higher Sharpe ratios, higher median returns, and higher win rates on daily timeframes. However, short strangles consistently showed lower maximum losses (-11.07% vs -13.68% monthly), making them more suitable for risk-averse traders. The weekly timeframe is notable: strangles had a higher win rate (60.38% vs 58.49%) but a negative Sharpe ratio (-0.028), meaning the wins were small relative to the losses.
Short Straddle vs Short Strangle: Monthly Return Distribution
| Metric | Straddle | Strangle |
|---|---|---|
| Max Loss (worst month) | -13.7% | -11.1% |
| Median Return | +1.80% | +1.25% |
| Max Return (best month) | +6.62% | +5.21% |
| Return Range (best – worst) | 20.3 pp | 16.3 pp |
Data: Panoptic Research (monthly rolling backtest, May 2024–Apr 2025)
3. Breakeven Comparison: How Much Does the Stock Need to Move?
A critical difference in the strangle vs straddle options debate is the breakeven point—how far the underlying must move for a long position to profit or a short position to begin losing money. The table below uses a $100 stock example.
| Component | Long Straddle | Long Strangle |
|---|---|---|
| Stock Price | $100 | $100 |
| Call Strike | $100 (ATM) | $105 (OTM) |
| Put Strike | $100 (ATM) | $95 (OTM) |
| Total Premium Paid | $8.50 | $4.25 |
| Upper Breakeven | $108.50 (+8.5%) | $109.25 (+9.3%) |
| Lower Breakeven | $91.50 (-8.5%) | $90.75 (-9.3%) |
| Move Needed to Break Even | ±8.5% | ±9.3% |
| Max Loss (Long) | $850 | $425 |
The long straddle costs $850 but needs only an 8.5% move to break even. The long strangle costs half ($425) but needs a 9.3% move. This is the core strangle vs straddle options trade-off for buyers: straddles have a higher dollar cost but respond faster to price movement because ATM options have higher delta. Strangles risk less capital upfront but have a higher chance of expiring worthless because the stock must clear two OTM strikes before generating profit.
Long Straddle vs Strangle: Cost and Breakeven Comparison ($100 Stock)
| Premium Cost |
Straddle: $8.50
|
|
Strangle: $4.25
|
|
| Move to BE |
Straddle: u00b18.5%
|
|
Strangle: u00b19.3%
|
|
| Max Loss |
Straddle: $850
|
|
Strangle: $425
|
|
Chart: Lambda Finance | Hypothetical $100 stock, 30 DTE options
4. When to Use a Straddle vs a Strangle
The optimal strategy depends on the market scenario. The table below maps specific situations to the best strangle vs straddle options choice, with the reasoning behind each recommendation.
| Scenario | Best Strategy | Direction | Why |
|---|---|---|---|
| Earnings report (expecting big move) | Long Straddle | Long | Narrower breakevens; ATM delta captures move faster; IV is already elevated |
| Earnings report (expecting IV crush) | Short Strangle | Short | OTM strikes give wider profit zone; IV crush benefits both legs |
| Low IV environment (expecting vol expansion) | Long Strangle | Long | Cheap premium; vega exposure without paying ATM prices |
| High IV environment (expecting contraction) | Short Straddle | Short | Maximum premium collection; ATM theta decay is fastest |
| Range-bound market, income generation | Short Strangle | Short | Wide profit zone; lower margin; higher win rate on weekly basis |
| Binary event (FDA ruling, merger vote) | Long Straddle | Long | Binary = large move either direction; straddle captures it with less movement needed |
| Small account, limited capital | Long Strangle | Long | ~50% cheaper than straddle; defined risk at lower absolute dollar amount |
The decision framework reduces to two questions: (1) Do you expect the move to be large or are you selling premium? If buying, straddles need less movement. If selling, strangles give a wider profit zone. (2) Is IV high or low? High IV favors selling (short straddle for max premium, short strangle for wider safety margin). Low IV favors buying (long strangle for cheap vega exposure, long straddle if a catalyst is imminent).
5. Short Strangle Management: 11-Year SPY Backtest
The management approach significantly impacts strangle vs straddle options outcomes. projectfinance tested four management strategies on 16-delta SPY short strangles over 11 years (60 DTE, monthly cycle).
| Management Approach | Win Rate | Max Loss | % Trades Hitting Stop | Overall Result |
|---|---|---|---|---|
| Hold to expiration (no management) | Baseline | $2,808 | — | Profitable (volatile) |
| 25% profit target | Highest | Larger per loss | — | Profitable |
| 50% profit target | Higher | Larger per loss | — | Profitable |
| 50% stop-loss | Lowest | Capped (tight) | ~50% | Marginal |
| 100% stop-loss | Higher | Capped (medium) | ~25% | Profitable |
| 50% profit + 100% stop (combined) | Best combined | Controlled | ~25% | Most consistent |
The 50% stop-loss triggered on nearly half of all trades over 11 years, making it impractical for systematic use. The 100% stop-loss was hit on approximately 25% of trades, and 66% of those positions eventually reached the 200% loss level. The most consistent approach was combining a 50% profit target with a 100% stop-loss: take profits quickly and give losses more room, but still cap downside. All management approaches suffered severe drawdowns during the February 2018 volatility spike, when actual losses exceeded stop-loss levels due to bid-ask spread widening.
6. Volatility Crush: The Hidden Risk for Long Straddles and Strangles
Both long straddles and long strangles are vulnerable to IV crush—the rapid decline in implied volatility after an event resolves. The table below quantifies this effect.
| IV Crush Metric | Typical Range | Impact on Long Straddle | Impact on Long Strangle |
|---|---|---|---|
| IV decline post-earnings (1 session) | -30% to -60% | High loss (high vega) | Moderate loss (lower vega) |
| Stock move needed to offset crush | — | Must exceed implied move | Must exceed implied move + OTM gap |
| Long straddle earnings win rate | ~50% | Wins on large movers; loses on “as expected” results | |
| Bid-ask spread widening (earnings) | +12–18% | Additional hidden cost when entering or exiting | |
Implied volatility can drop 30–60% in a single session after earnings, FDA decisions, or other binary events. For long straddle holders, this means even a correct directional call can lose money if the stock move doesn’t exceed the implied move priced into the options. The long straddle earnings strategy wins approximately 50% of the time, with occasional large winners offsetting frequent moderate losses. Long strangles face an even higher bar: the stock must not only exceed the implied move but also cross the OTM strike gap before profits begin. For this reason, short straddles and strangles are structurally favored around known events where IV is elevated.
7. Key Takeaways
- Short straddles generate higher returns (median +1.80% monthly vs +1.25%) and capture more daily theta (40–50% vs ~25%), but carry larger maximum drawdowns (-13.7% vs -11.1%).
- Short strangles have tighter risk profiles and win more often on weekly timeframes (60.38% vs 58.49%), making them better suited for consistent income generation with less margin usage.
- Long straddles cost ~2x more but need less movement to profit. A $100 stock straddle breaks even at ±8.5% vs ±9.3% for a strangle, because ATM options have higher delta.
- Long strangles are cheaper and risk less capital, but have a higher probability of expiring worthless. Best used when IV is low and a large move is expected.
- IV crush is the primary risk for long positions. Post-earnings IV can drop 30–60%, destroying long straddle/strangle value even when direction is correct. Long straddle earnings win rate is approximately 50%.
- The best management approach for short strangles is a 50% profit target combined with a 100% stop-loss, based on projectfinance’s 11-year SPY backtest.
Methodology
This analysis uses backtest data from Panoptic Research (daily, weekly, monthly rolling short straddle and strangle returns, May 2024–April 2025), projectfinance’s 11-year SPY short strangle management study (16-delta, 60 DTE, monthly cycle), tastytrade mechanical strategy research on theta decay capture rates, and Fidelity’s event-driven straddle/strangle analysis. Win rates represent the percentage of trades closing in profit under specified parameters. Breakeven calculations use standard options pricing formulas with hypothetical premiums for illustration. IV crush data is sourced from SpotGamma and represents typical behavior for S&P 500 component stocks around earnings announcements. All return figures are before fees and taxes. Data compiled March 2026 by Lambda Finance.
Related Articles
- Broken Wing Butterfly Options Strategy: Setup and Backtest Data
- Best Indicator for Option Trading: Win Rates and Backtest Data
Sources
Backtest Studies
- Panoptic Research — Straddles vs Strangles: Which Short Vol Strategy Wins — Daily, weekly, and monthly rolling backtest with win rates, Sharpe ratios, and return distributions
- projectfinance — Short Strangle Management Results (11-Year SPY Study) — 16-delta strangle management with profit targets, stop-losses, and combined approaches over 11 years
- SteadyOptions — Selling Short Strangles and Straddles: Does It Work? — Analysis of short premium viability with return expectations and risk scenarios
Strategy Guides & Education
- Charles Schwab — Straddles vs Strangles Options Strategies — Structural comparison with breakeven formulas, risk profiles, and use case guidance
- Charles Schwab — Short Straddles vs Strangles Options Strategies — Premium selling comparison with margin requirements and IV crush analysis
- Fidelity — Using Straddles and Strangles to Manage Stock Events (PDF) — Event-driven application guide with earnings examples and IV crush mechanics
- Option Alpha — Straddle vs Strangle: Complete Comparison — Visual payoff diagrams, theta decay comparison, and strategy selection framework
Volatility & Earnings Research
- SpotGamma — IV Crush Explained: What It Is, When It Happens, and How to Trade It — Quantification of post-event implied volatility decline (30–60%) and impact on option pricing
- OptionsTrading IQ — Does the Long Straddle Earnings Strategy Actually Work? — Earnings straddle win rate analysis (~50%) with risk/reward assessment
- SSRN — 17-Year Backtest of Straddles Around S&P 500 Earnings (Khan & Khan) — Academic study of earnings straddle performance across 17 years of S&P 500 announcements