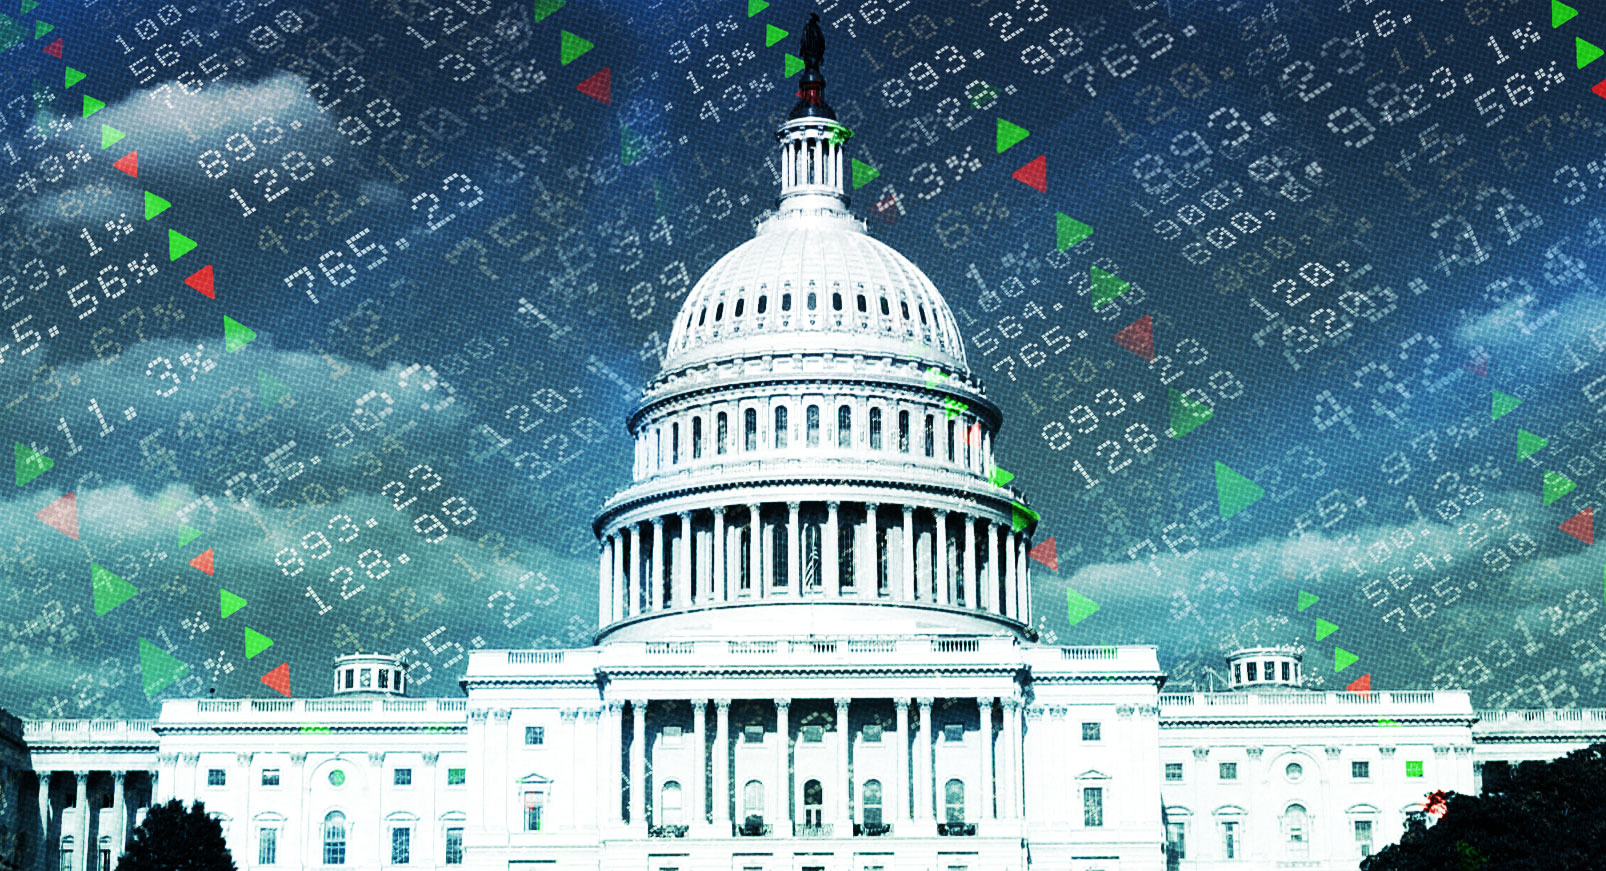
Congress Stock Market Performance, 2026 Report
In 2025, members of Congress collectively underperformed the stock market for the first time in years. Only 32.2% of congressional portfolios beat the S&P 500 (100 out of 311 backtested portfolios), down dramatically from 42.5% in 2024.
While the S&P 500 returned 16.8% in 2025, congressional portfolios averaged just 15.8%. Republicans narrowly outperformed at 17.3%, while Democrats underperformed at 14.4%, a reversal from their tech-driven dominance in 2024.
Key Findings:
- Congress became net sellers of equities: $170M sold vs. $125M purchased
- The largest capital rotation in history: $81.7M poured into bonds and municipal securities
- Only 10 members achieved returns above 50%; Rep. Warren Davidson led with 78.8%
- 1,200+ trades were disclosed late, with some hidden for nearly 1,000 days
- Republicans adopted “risk-off” strategies while Democrats doubled down on tech
This comprehensive report analyzes every congressional stock trade in 2025, revealing which members made the most money, which strategies worked, and where conflicts of interest emerged.
CONGRESS STOCK MARKET PERFORMANCE VS. S&P 500 – 2025
Primary Finding: Congress Struggles to Beat the Market
| Group | Average Return 2025 | vs. S&P 500 | Performance |
|---|---|---|---|
| S&P 500 Benchmark (SPY) | 16.8% | — | — |
| Republicans | 17.3% | 16.8% | +0.5 pp outperformance |
| Democrats | 14.4% | 16.8% | -2.4 pp underperformance |
| Congress (Backtested Portfolios) | ~15.8% | 16.8% | -1.0 pp underperformance |
Key Research Insights:
• Success Rate: Only 100 of 311 backtested congressional portfolios beat the S&P 500 in 2025 (32.2% success rate), representing the worst performance relative to the market in recent years and mirroring the success rate of professional fund managers (33% per Morningstar 2025 analysis).
• Net Divestment: Congress became net sellers of stocks in 2025, divesting $170 million in equities while purchasing only $125 million, a $45 million net exit suggesting defensive positioning amid tariff uncertainty and policy volatility.
• Flight to Safety: Bond allocations surged as equities declined: Lawmakers allocated $57.4 million to bonds and $32.1 million to municipal securities with minimal selling in either category, marking a dramatic “flight to safety” rotation.
TOP 10 CONGRESS STOCK MARKET TRADERS BY PERFORMANCE – 2025
| Rank | Member | Party | State | 2025 Return | Key Holdings/Strategy |
|---|---|---|---|---|---|
| 1 | Rep. Warren Davidson | R | OH | +78.8% | GE, GE Vernova (GEV) concentrated bet |
| 2 | Rep. Donald Norcross | D | NJ | +70.8% | Minimalist two-stock portfolio |
| 3 | Rep. Terri Sewell | D | AL | +67.9% | Concentrated holdings |
| 4 | Rep. Bryan Steil | R | WI | +64.0% | Diversified portfolio, chairs House Admin Committee |
| 5 | Rep. Tim Moore | R | NC | +52.0% | Small-cap stocks, semiconductors, 200+ trades |
| 6 | Sen. Ted Cruz | R | TX | +50.0% | Goldman Sachs (GS) large holding, sold at highs |
| 7 | Rep. Lisa McClain | R | MI | +37.0% | TSMC, Nvidia (NVDA), 1,200+ trades |
| 8 | Sen. Pete Ricketts | R | NE | +37.0% | Diversified approach |
| 9 | Rep. Thomas Suozzi | D | NY | +35.0% | Nvidia-heavy portfolio ($9.5M portfolio) |
| 10 | Sen. Lisa Murkowski | R | AK | +35.0% | Mixed holdings |
Performance Insights:
• Concentration over Diversification: Rep. Warren Davidson’s 78.8% return was driven by a concentrated, high-conviction bet on General Electric (GE) and its spinoff GE Vernova (GEV) in the Industrials and Utilities sectors, proving that focus, not diversification, drove top performance in 2025.
• Aggressive Alpha: Rep. Tim Moore led with 200+ disclosed trades including aggressive small-cap positions like Cracker Barrel (CBRL) and Genprex (GNPX), plus heavy semiconductor exposure through Super Micro Computer (SMCI), which delivered +43.1% alpha in 14 days following his purchase.
• Strategic Exits: Sen. Ted Cruz’s 50% return came primarily from a large Goldman Sachs (GS) position which he strategically sold near all-time highs after GS gained significantly in 2025.
• Volume vs. Returns: High trading volume didn’t guarantee success: Rep. Marjorie Taylor Greene made 1,000+ trades but returned only +11.7%, while Rep. Lisa McClain disclosed 1,200+ trades for +37%—both highlighting that frenetic activity often trails concentrated “buy and hold” strategies.
CONGRESS STOCK PERFORMANCE BY POLITICAL PARTY – 2025
| Metric | Democrats | Republicans | Difference |
|---|---|---|---|
| Portfolio Return | 14.4% | 17.3% | +2.9 pp (R) |
| vs. S&P 500 (16.8%) | -2.4 pp underperformance | +0.5 pp outperformance | R wins |
| Total Transaction Value | $130.8M buys / $100.0M sells | $194.6M buys / $197.4M sells | R net sellers |
| Net Equity Position | +$30.8M net buyers | -$2.8M net sellers | D buying, R selling |
| Technology Allocation | Heavy (remained buyers) | Light (net sellers) | Opposite strategies |
| Bond/Muni Allocation | $3.5M municipals | $28.6M municipals (89%) | R flight to safety |
Party Performance Insights:
• Republican “Risk-Off” Strategy: GOP members divested $107 million in stocks while simultaneously pouring $48 million into bonds and $29 million into municipal securities, suggesting anticipation of market volatility under the administration’s tariff policies.
• Democrat “Risk-On” Tech Focus: Unlike their Republican colleagues, Democrats acquired $27 million in Technology stocks while selling only $14 million, effectively doubling down on the sector—but this strategy backfired as they underperformed the market by 2.4 percentage points.
• Cryptocurrency Conviction: Republicans drove 98% of congressional crypto purchases ($2.9 million), led by freshman Rep. Brandon Gill (R-TX) who bought up to $2.5 million in Bitcoin in his first six months in office, coinciding with the passage of the GENIUS Act.
• Options Sophistication: Democrats disclosed $4.8 million in options purchases compared to just $555,000 from Republicans, with Sen. John Hickenlooper ($2.75M) and Rep. Nancy Pelosi ($2.6M) leading in complex derivative strategies.
HIGHEST-PERFORMING SECTORS FOR CONGRESSIONAL PORTFOLIOS – 2025
| Sector | Buy Volume | Sell Volume | Net Position | % Change |
|---|---|---|---|---|
| Technology | $41.8M | $45.3M | -$3.5M | Net exit |
| Financial Services | $12.6M | $25.8M | -$13.2M | Heavy selling |
| Healthcare | $13.7M | $18.7M | -$5.0M | Net exit |
| Consumer Cyclical | $12.5M | $18.3M | -$5.8M | Defensive rotation |
| Industrials | $11.2M | $16.3M | -$5.1M | Net selling |
| Bonds (Fixed Income) | $57.4M | $3.1M | +$54.3M | Massive inflow |
| Municipal Securities | $32.1M | $7.8M | +$24.3M | Safe haven |
Sector-Specific Insights:
• The Semiconductor Split: Within Technology, Congress exited $11.7 million in Software while buying $17 million in Semiconductors-Nvidia (NVDA) alone received $11.2 million in new allocations.
• Financial Exodus: Members sold $25.8 million against just $12.6 million in buys, driven by large divestments in Bwin and Goldman Sachs.
• Fixed Income Dominance: The combined $81.7 million net inflow into bonds and municipal securities represented the single largest capital rotation in congressional trading history.
CONCLUSION
Lambda Finance’s analysis of 2025 congressional stock trading shows broad underperformance and rising compliance issues. Only 32.2% of members beat the market (down from 42.5% in 2024), as Congress became a net seller of $45M in equities while rotating $81.7M into bonds and municipal securities. Democrats underperformed the S&P 500 by 2.4 percentage points, while Republicans narrowly outperformed by 0.5 points, driven largely by municipal bond exposure. Overall, congressional performance mirrored professional fund managers, 67% of whom also trail their benchmarks.
Compliance failures worsened: 40 members violated the STOCK Act, with disclosures delayed by months or years. Despite eight proposed bills to ban congressional stock trading in 2025, none reached a floor vote. Suspicious trade timing around policy announcements persists.
To request a PDF of the 2026 report or track congressional trades in real time, visit Lambda Finance’s Congressional Trading Tool.