Broken Wing Butterfly Options Strategy: Setup, Backtest Data, and Performance Guide (2025)
Lambda Finance compiled broken wing butterfly options strategy data from SPX and SPY backtests, academic research from Portland State University, OptionsTrading IQ’s butterfly spread study, and practitioner methodology from Data Driven Options and Theta Profits. This report covers the strategy’s mechanics, optimal parameters, backtest performance across multiple DTE and delta settings, and a direct comparison against standard butterflies and iron condors. The broken wing butterfly options strategy produces win rates of 65–80% depending on configuration, with annualized returns of approximately 35% on buying power at the 21 DTE setting. The key advantage over a standard butterfly is the ability to enter for a net credit, eliminating risk on one side of the trade. The tables below detail every setup parameter, payoff calculation, and backtest result.
1. What Is the Broken Wing Butterfly Options Strategy?
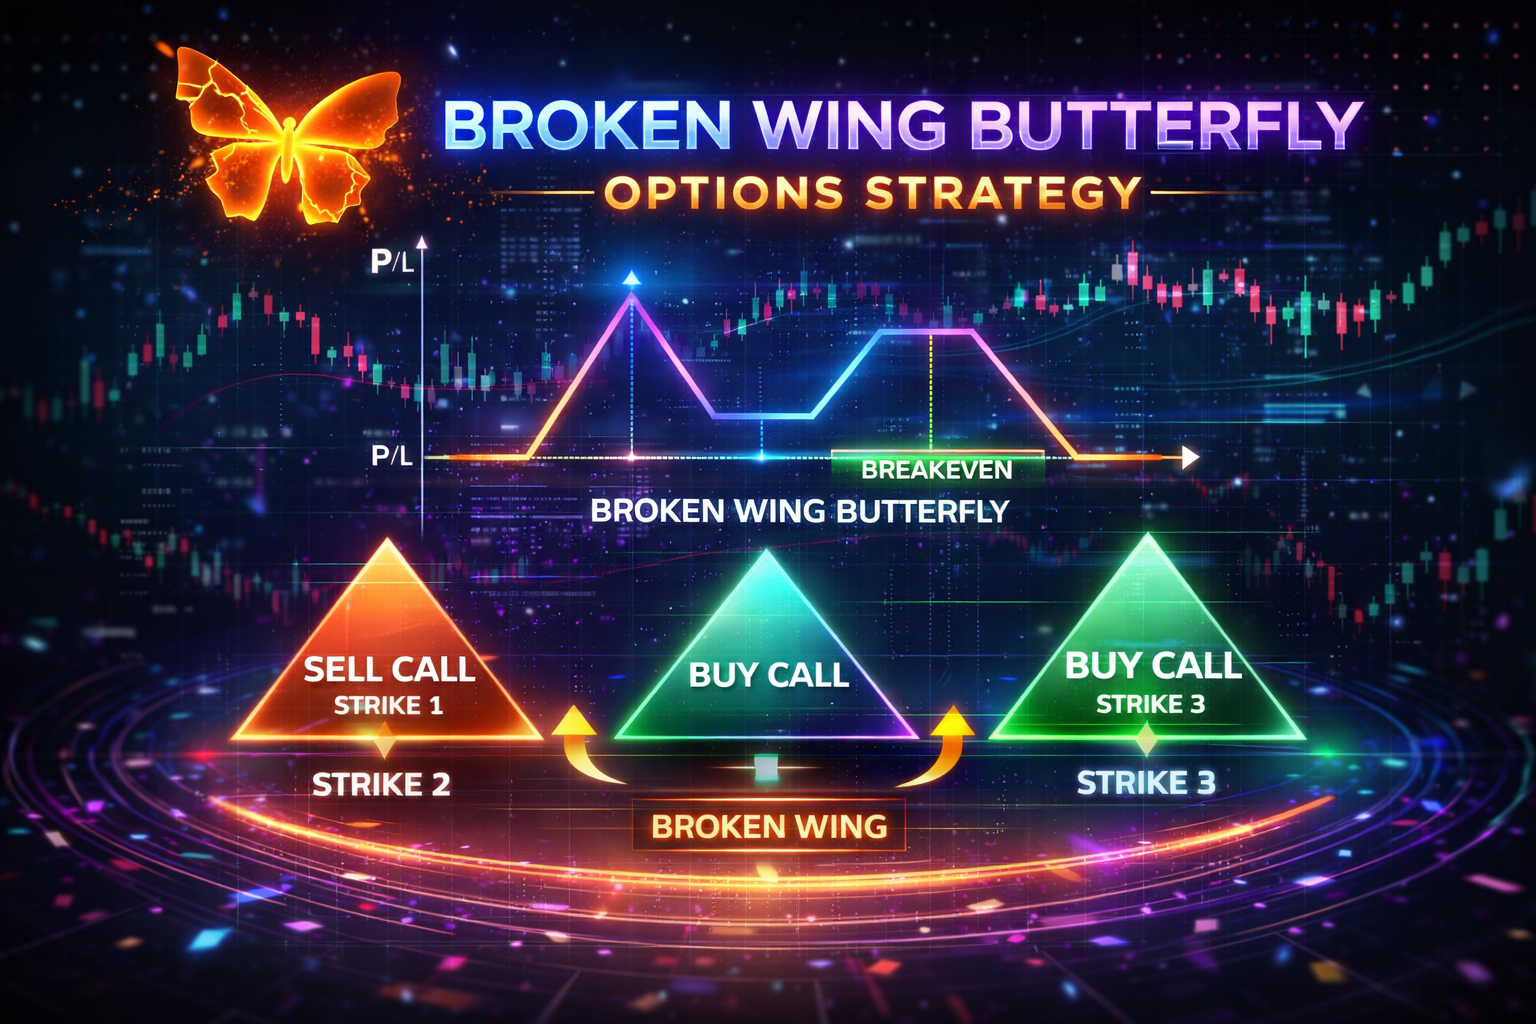
The broken wing butterfly options strategy modifies the standard butterfly by widening one wing, creating an asymmetric payoff structure. The table below compares the three variants side by side.
| Component | Standard Butterfly | Broken Wing Butterfly (Put) | Broken Wing Butterfly (Call) |
|---|---|---|---|
| Structure | Buy 1 / Sell 2 / Buy 1 (equal width) | Buy 1 / Sell 2 / Buy 1 (lower wing wider) | Buy 1 / Sell 2 / Buy 1 (upper wing wider) |
| Strike Symmetry | Symmetric (equal distances) | Asymmetric (lower wing wider) | Asymmetric (upper wing wider) |
| Typical Entry | Net debit | Net credit or zero cost | Net credit or zero cost |
| Risk on Narrow Side | Debit paid | Zero (if entered for credit) | Zero (if entered for credit) |
| Risk on Wide Side | Debit paid | Width difference minus credit | Width difference minus credit |
| Max Profit Location | At short strike | At short strike | At short strike |
| Directional Bias | Neutral | Slightly bullish | Slightly bearish |
| Best Environment | Pin at short strike | Slow steady uptrend or sideways | Slow steady downtrend or sideways |
The defining feature of the broken wing butterfly options strategy is the elimination of risk on one side. In a put BWB, the lower (protective) put is placed further away than in a standard butterfly, which generates enough extra credit to offset or exceed the debit on the upper (narrow) side. This means if the stock rallies above all strikes, the trader either breaks even or keeps a small credit. All risk shifts to the downside—the wide wing direction.
2. Broken Wing Butterfly Setup: Strike Selection and Parameters
The table below details the specific parameters used in the most commonly backtested broken wing butterfly options strategy configurations.
| Parameter | 21 DTE (Popular) | 30 DTE | 45 DTE |
|---|---|---|---|
| Days to Expiration (entry) | 21 days | 30 days | 45 days |
| Upper Long Put Delta | ~32 delta | ~30 delta | ~25 delta |
| Short Puts Delta (x2) | ~28 delta | ~25 delta | ~20 delta |
| Lower Long Put Delta | ~20 delta | ~15 delta | ~10 delta |
| Narrow Wing Width | 1x (e.g., 10 pts on SPX) | 1x | 1x |
| Wide Wing Width | 2x (e.g., 20 pts on SPX) | 2x–3x | 2x–3x |
| Min Premium Target | 10–15% of narrow wing width | 10–12% | 8–10% |
| Profit Target | Close at 1.5–2% of narrow wing | 15–20% of max profit | 15–20% of max profit |
| Stop Loss | 2x premium collected | 20–30% of max loss | 20–30% of max loss |
| Exit DTE | 7 DTE (if not hit target) | 7–10 DTE | 14–21 DTE |
The 21 DTE configuration is the most widely traded version of the broken wing butterfly options strategy. The key setup rule: the narrow wing should be approximately half the width of the wide wing (1x vs 2x), which ensures the wider short vertical generates enough credit to offset the narrow long vertical. The delta sequence of 32/28/20 places the body of the butterfly slightly below the current price, creating a bullish lean that profits from the market drifting sideways or slightly higher.
3. Broken Wing Butterfly Backtest Performance
The table below compiles backtest results from multiple sources across different DTE settings and management approaches for the broken wing butterfly options strategy and comparable standard butterfly configurations.
| Configuration | Win Rate | Total Return | Avg Win | Avg Loss | Source |
|---|---|---|---|---|---|
| Broken Wing Butterfly (Put BWB) | |||||
| 21 DTE BWB, SPX (δ 32/28/20) | ~80% | ~35% ann. | $46 avg | Varies | Data Driven Options |
| 21 DTE BWB, SPX (Carl Allen) | ~80% | ~2.5% per trade | — | — | Theta Profits |
| Standard Butterfly (for comparison) | |||||
| 30 DTE, SPX, 15δ wings, 20% PT/SL | 66.7% | +25.3% | $119 | -$91 | OptionsTrading IQ |
| 30 DTE, SPX, 20δ wings, 20% PT/SL | 66.7% | +25.1% | $166 | -$185 | OptionsTrading IQ |
| 15 DTE, SPX, 15δ wings, 8%PT/12%SL | 69.7% | +22.3% | $57 | -$75 | OptionsTrading IQ |
| 45 DTE, SPX, 15δ wings, 20% PT/SL | 44.0% | -11.6% | $91 | -$143 | OptionsTrading IQ |
The broken wing butterfly options strategy at 21 DTE produced the highest win rate (~80%) and best annualized return (~35%) among the configurations tested. However, the per-trade dollar gain was modest ($46 avg) because buying power used is relatively small. Standard butterflies at 30 DTE with a 20% profit target and 20% stop loss produced the most balanced risk/reward at 66.7% win rate and +25.3% total return. The 45 DTE configuration was the worst performer at -11.6% total return and only 44% win rate—too much time for the underlying to move away from the profit zone.
Butterfly Strategy Win Rates by Configuration
| BWB 21 DTE |
80% win rate — ~35% ann.
|
| Std 15 DTE 8/12 |
69.7% win rate — +22.3%
|
| Std 30 DTE 20/20 |
66.7% win rate — +25.3%
|
| Std 45 DTE 20/20 |
44% win rate — -11.6%
|
Chart: Lambda Finance | Data: Data Driven Options, Theta Profits, OptionsTrading IQ
4. Payoff Calculation: Max Profit, Max Loss, and Breakeven
Understanding the payoff structure is essential before trading the broken wing butterfly options strategy. The table below walks through a complete SPX example.
| Component | Strike / Value | Action |
|---|---|---|
| SPX Price at Entry | 5,800 | — |
| Upper Long Put (narrow wing) | 5,770 (~32δ) | Buy 1 |
| Short Puts (body) | 5,760 (~28δ) | Sell 2 |
| Lower Long Put (wide wing) | 5,740 (~20δ) | Buy 1 |
| Narrow Wing Width | 10 points | (5,770 − 5,760) |
| Wide Wing Width | 20 points | (5,760 − 5,740) |
| Net Credit Received | $1.50 ($150) | Credit entry |
| Max Profit | $11.50 ($1,150) | Narrow width + credit (at 5,760) |
| Max Loss (downside) | $8.50 ($850) | Wide minus narrow minus credit (below 5,740) |
| Max Loss (upside) | $0 (profit of $150) | Keep credit (above 5,770) |
| Lower Breakeven | 5,748.50 | Lower long + max loss |
The key payoff asymmetry: max profit ($1,150) is 1.35x the max loss ($850), and the upside has zero risk because the position was entered for a credit. This means the stock can rally to any level above 5,770 and the trader keeps the $150 credit. All risk is concentrated below 5,740—a move of approximately 1.0% below entry. The trade profits most when SPX stays near 5,760 (the short strike) at expiration, but any close between 5,748.50 and 5,770 generates some profit.
5. BWB vs Iron Condor vs Standard Butterfly
The table below provides a direct comparison of the broken wing butterfly options strategy against the two strategies it is most often evaluated against.
| Metric | Broken Wing Butterfly | Iron Condor | Standard Butterfly |
|---|---|---|---|
| Typical Win Rate | 65–80% | 65–75% | 55–67% |
| Entry Type | Credit or zero cost | Credit | Debit |
| Risk Distribution | One-sided (directional risk only) | Two-sided | Two-sided (symmetric) |
| Max Profit / Max Loss Ratio | 1.0x–1.5x | 0.3x–0.5x | 2x–10x |
| Profit Zone Width | Moderate (one-directional) | Wide (both sides) | Narrow (pinned at body) |
| IV Sensitivity | Moderate (benefits from IV drop) | High (benefits from IV drop) | Low |
| Legs Required | 3 (buy 1, sell 2, buy 1) | 4 (two vertical spreads) | 3 (buy 1, sell 2, buy 1) |
| Best For | Directional lean + income | Range-bound, neutral | Pinpoint price target |
Strategy Comparison: Win Rate vs Risk Distribution
| BWB (Put) |
65–80% — One-sided risk, credit entry
|
| Iron Condor |
65–75% — Two-sided risk, credit entry
|
| Std Butterfly |
55–67% — Two-sided risk, debit entry
|
Chart: Lambda Finance | Sources: Option Alpha, Interactive Brokers, OptionsTrading IQ
The broken wing butterfly options strategy occupies a unique middle ground: it has the credit entry and high win rate of an iron condor but with one-sided risk like a directional spread. The iron condor has a wider profit zone but risks loss on both sides. The standard butterfly has the best max-profit-to-max-loss ratio (often 2x–10x) but the lowest win rate because it requires the stock to pin at the body strike. The BWB trades some of that upside potential for the elimination of risk on one entire side.
6. Market Conditions and When the BWB Fails
The broken wing butterfly options strategy is not a universal solution. The table below identifies the conditions under which it performs well and when it produces losses.
| Market Condition | BWB Performance | Why |
|---|---|---|
| Slow steady uptrend | BEST | Price drifts above body; theta decay works in your favor; upside has no risk |
| Sideways / range-bound | GOOD | Price stays near body; max profit zone maintained |
| Buying the dip (entry after pullback) | GOOD | Mean-reversion sets up bullish lean; higher IV = richer credit |
| Sharp selloff (3%+ in days) | LOSS | Price breaches wide wing; max loss realized quickly; stop-loss may gap through |
| High volatility expansion | LOSS | Vega exposure on short puts expands losses before price breaches strikes |
| Strong sustained rally | SMALL WIN | No upside risk; keep credit; but miss larger gains from directional trades |
The broken wing butterfly options strategy fails most dramatically during sharp selloffs—when the market drops several percentage points within days of entry. In 2024–2025, increased intraday volatility and multiple gap-down events reduced win rates compared to the post-2020 period. The strategy also underperforms in high-volatility expansion environments because the short puts increase in value faster than the long puts provide protection. The best mitigation is the 2x premium stop-loss rule: if the position reaches a loss equal to twice the credit collected, close immediately.
7. Key Takeaways
- The broken wing butterfly options strategy eliminates risk on one side by widening one wing to create a credit entry. If the stock moves away from the risk side, the trader keeps the credit with no loss.
- The 21 DTE put BWB is the most popular configuration, using deltas of 32/28/20 with a 2:1 wide-to-narrow wing ratio. Backtest data shows ~80% win rate and ~35% annualized return on buying power.
- Standard butterflies at 30 DTE with 20% PT/SL produced +25.3% total return with 66.7% win rate in OptionsTrading IQ’s backtest. The 45 DTE setting was unprofitable (-11.6%).
- BWB vs iron condor: BWB has higher win rate (65–80% vs 65–75%) and one-sided risk, but narrower profit zone. Iron condors protect both sides but with lower reward-to-risk ratios (0.3x–0.5x).
- The strategy fails in sharp selloffs. Any move of 3%+ in the wide-wing direction within days of entry typically triggers max loss. 2024–2025 market conditions reduced performance compared to earlier backtests.
- Management is critical. Profit target of 1.5–2% of narrow wing width at 7 DTE, with a stop-loss at 2x premium collected, provides the most consistent results.
Methodology
This analysis uses backtest data from Data Driven Options (21 DTE put BWB on SPX, post-2020), Theta Profits and Carl Allen’s SPX trading methodology, OptionsTrading IQ’s butterfly spread backtest study (SPX, multiple DTE and delta settings), and academic research from Portland State University on differential evolution optimization of BWB parameters (SPY, 10+ years of historical data). Win rates represent the percentage of trades closing in profit under specified management rules. Standard butterfly backtests from OptionsTrading IQ use SPX monthly options with systematic entry and management. All return figures are before fees and taxes. Market condition assessments draw on practitioner experience from 2020–2025. Data compiled March 2026 by Lambda Finance.
Related Articles
- Diagonal Spread Options Strategy: Setup and PMCC Guide
- Strangle vs Straddle Options: Performance Data and Win Rates
Sources
Backtest Studies & Performance Data
- Data Driven Options — 21 Day Broken Wing Put Butterfly — Delta 32/28/20 methodology, ~80% win rate, 2.5% per trade on buying power
- Theta Profits — 21 DTE Put BWB: A High Probability Options Strategy — Carl Allen’s SPX approach with 12–15% premium targets and 7 DTE exit rules
- OptionsTrading IQ — Butterfly Spreads Backtest Results — Systematic backtest across 15/30/45/60 DTE, multiple delta widths, and management combinations on SPX
Strategy Guides & Education
- Option Alpha — How to Set Up a Broken-Wing Butterfly Option Strategy — Strike selection methodology, credit vs debit entry, and payoff structure guide
- Options Playbook (Fidelity) — Skip Strike Butterfly Put — Official Options Playbook definition with max profit, max loss, and breakeven formulas
- Interactive Brokers — Broken Wing Butterfly Spreads: Everything You Need to Know — Comprehensive guide covering call and put variants with margin and risk considerations
- Strike.money — Broken Wing Butterfly: Overview, Example, P&L, Risks — Payoff diagram, calculation walkthrough, and real-world risk scenarios
Academic Research
- SCIRP — Differential Evolution Optimization of the Broken Wing Butterfly Option Strategy — Academic study using evolutionary algorithms to optimize BWB parameters on SPY over 10+ years
- Portland State University — Forecasting Optimal Parameters of the BWB Using Differential Evolution — Master’s thesis on strike mapping methods and normalized parameter optimization for BWB on SPY